Contents
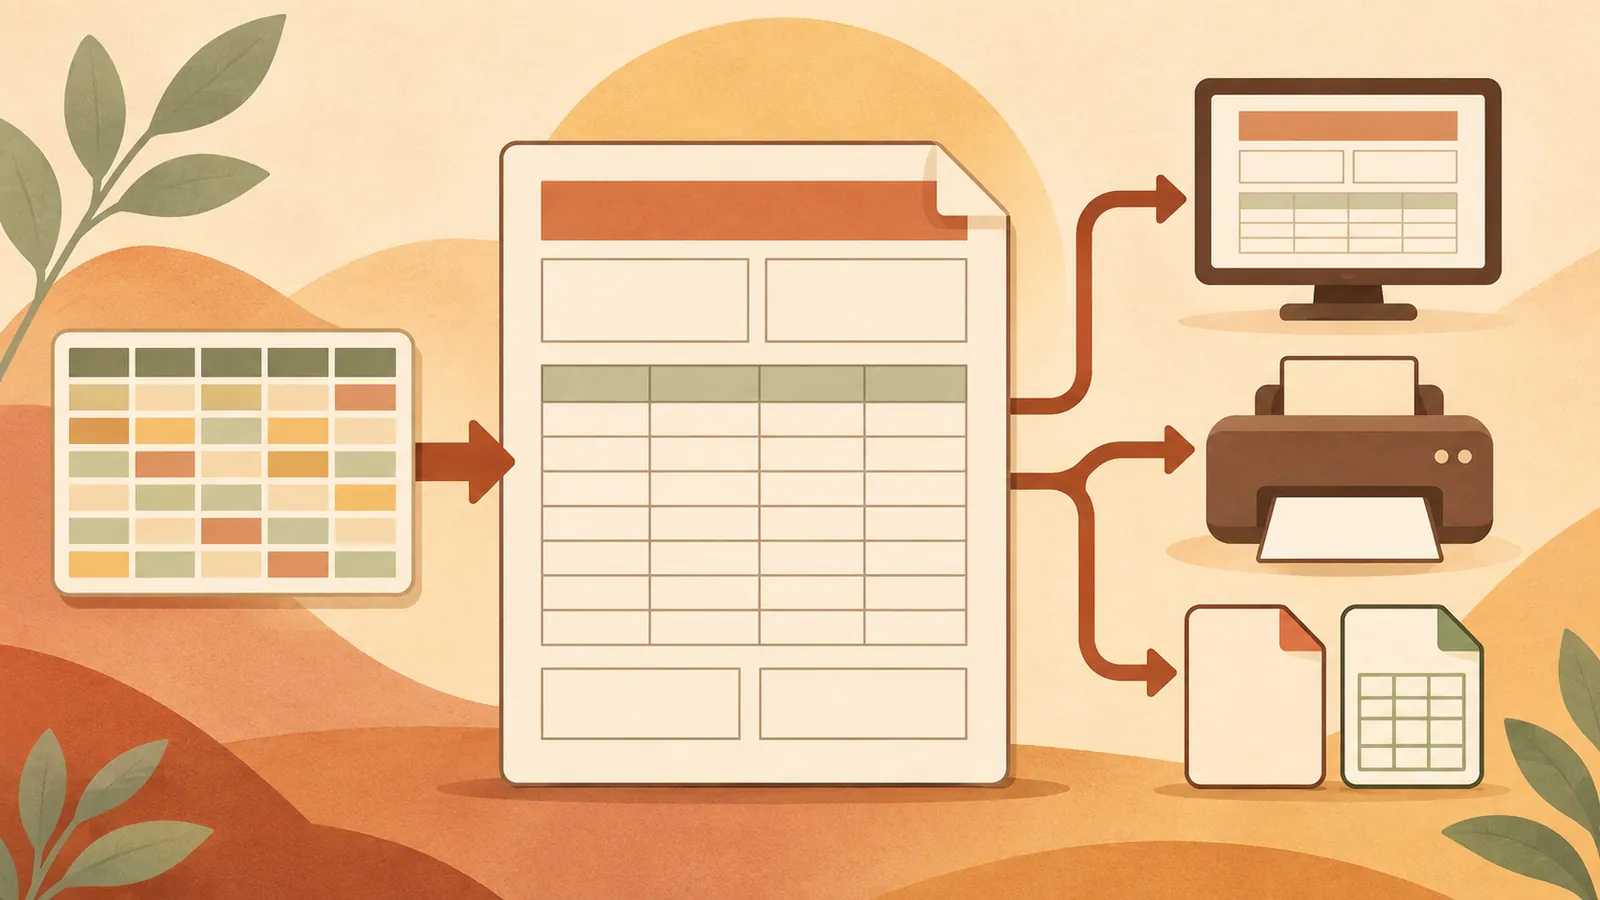
Advance Software’s AS-DataReport creates business reports from Excel templates and CSV data, supporting previews, printing, and PDF and Excel output. It handles both reports for individual records and reports with multiple detail rows, allowing report layouts to change without rebuilding the system that supplies the data.
Key Points#
- Create templates in Excel and map CSV columns to cells using supported methods, such as matching names.
- Create reports for each record, or group records by fields such as company name to create reports with detail rows.
- Use the desktop application for interactive output and the console application for recurring batch processing.
- Reporting features are also available through an Excel add-in and a .NET component.
What the Product Can Do#
AS-DataReport separates report layouts from the business system that generates the data. The system outputs CSV files, while Excel templates determine how the data appears in the finished reports. It is suited to documents such as quotations and delivery notes whose layouts vary by customer.
It supports subtotals, totals, page-level calculations, and automatic page breaks. It can also insert images such as company seals and generate barcodes, including QR codes. Layouts can switch based on data values to create reports with different formats for each customer.
The actual benefits depend on the existing output data. If it already includes the required fields, much of the work can be handled through templates and report settings. Any missing data must still be supplied by the source system.
Map CSV Fields to Excel#
Create Excel reports using familiar formatting features such as cell sizing, fonts, and borders. Existing Excel reports can serve as templates, potentially allowing you to reuse layouts you already maintain.
One straightforward mapping method uses named cells in Excel. If the CSV has a column header named LastTrans, name the destination cell LastTrans. When generating the report, AS-DataReport places the column’s value in the cell with the same name. It also supports product-specific variables and CSV headers that specify cell addresses such as A12.
Initial testing steps:
1. Prepare a CSV with column headers in the first row and records in the subsequent rows. 2. Create an Excel template and give the destination cells the same names as the column headers. 3. Select the template and CSV in the report creation application, then specify the output filename. 4. Check the results in the preview before generating a PDF or Excel file.
Group Records to Create Reports with Detail Rows#
For simple reports, each CSV record generates one page. In this mode, a CSV containing eight records therefore produces eight pages.
Reports with detail rows combine multiple records into one report using a specified key. For example, five delivery records for Company A and three for Company B can produce one delivery note with five detail rows and another with three. Groups that do not fit on one page are handled with automatic page breaks.
To configure this behavior, switch the application’s report creation mode to the mode that uses a report settings file, then select a file prepared in a separate settings screen. You can also configure different Excel layouts for each company. No programming is required, but grouping and layout rules must be configured.
Choose How to Generate Reports#
The desktop application is the easiest starting point for staff who select files, check previews, and generate reports. The console application accepts CSV data, an Excel template, and an output filename as command-line arguments. Saving a tested command in a .bat file lets you repeat the same process without entering the settings each time.
The Excel add-in supports report creation and importing CSV data into existing Excel tables. Fields can be imported as text, preventing Excel’s automatic conversion from altering values such as identification numbers with leading zeros.
For application developers, a .NET component provides report creation features that can be embedded in software. It also supports report previews in a browser. Since this approach requires development work, the desktop application is easier for an initial evaluation.
What to Check Before Adoption#
The supplied announcement is an advertising article dated November 9, 2026. It introduces the available features but provides no third-party measurements of processing speed, output accuracy, or time savings.
Before choosing the product, check the vendor’s documentation for pricing, licensing, supported operating systems, Excel requirements, and deployment prerequisites. Test text wrapping, tax calculations, page breaks, and customer-specific layouts using representative files. Correct output from a one-page sample does not guarantee that a long report with detail rows will print correctly.
Next Steps#
Create a PDF from an actual Excel report and representative CSV data, then compare it with an approved report to check field placement, totals, and page breaks.
Source: https://www.publickey1.jp/blog/26/excelcsvas-datareportpr.html
Contents